SSSICK/BUOY/Usage/SW0 21: Difference between revisions
mNo edit summary |
|||
| Line 4: | Line 4: | ||
=Usage= | =Usage= | ||
There are four taps on the sidebar: Setup, Graph, Tune, and About. | |||
There are | == Setup == | ||
You will configure your connection and connect to your SSSICK from here. The list menu displays available devices and ports. Select the port at which your unit is connected, and click "connect" to connect. In Windows you should see "SSSICK" or the port and port number. In Linux you will see the corresponding raw device path (e.g. "/dev/tty9" or "dev/rfcommX" if using rfcomm to connect). | You will configure your connection and connect to your SSSICK from here. The list menu displays available devices and ports. Select the port at which your unit is connected, and click "connect" to connect. In Windows you should see "SSSICK" or the port and port number. In Linux you will see the corresponding raw device path (e.g. "/dev/tty9" or "dev/rfcommX" if using rfcomm to connect). | ||
| Line 14: | Line 13: | ||
Click "refresh" to update the drop-down with currently available devices and ports. When not connected to a device, this list automatically updates every 2 seconds. | Click "refresh" to update the drop-down with currently available devices and ports. When not connected to a device, this list automatically updates every 2 seconds. | ||
===Error Codes=== | === Error Codes === | ||
The SSSICK can store running error codes for any number of things, such as out of specification sensors, power supply issues, problems reading or writing from internal memory, and even self-tests to verify the true output from the SSSICK is what it should be. | The SSSICK can store running error codes for any number of things, such as out of specification sensors, power supply issues, problems reading or writing from internal memory, and even self-tests to verify the true output from the SSSICK is what it should be. | ||
If your SSSICK's LED is red (and you have not set it to red through the custom LED color section), then your SSSICK has a stored error code. Click "Read Codes" to display which codes your unit had stored. Click "Clear Codes" to clear any stored codes. | If your SSSICK's LED is red (and you have not set it to red through the custom LED color section), then your SSSICK has a stored error code. Click "Read Codes" to display which codes your unit had stored. Click "Clear Codes" to clear any stored codes. | ||
== Graph == | |||
==Graph== | |||
[[File:Buoy grapher window.png]] | [[File:Buoy grapher window.png]] | ||
From this tab you can display, graph, and log airflow and air temperature (on HW R020 and newer) values. | From this tab you can display, graph, and log airflow and air temperature (on HW R020 and newer) values. | ||
===Airflow Display=== | ==== Airflow Display ==== | ||
Airflow is displayed on both the graph and on the top-right corner of the window in large text to make for easy reading. | Airflow is displayed on both the graph and on the top-right corner of the window in large text to make for easy reading. | ||
===Start Graphing=== | ==== Start Graphing ==== | ||
To start showing and graphing, click "Start Graphing". | To start showing and graphing, click "Start Graphing". | ||
===Start Logging=== | ==== Start Logging ==== | ||
To log what is being graphed, click "Start Logging". | To log what is being graphed, click "Start Logging". | ||
===Set Logging Path=== | ==== Set Logging Path ==== | ||
You can set a custom save location for your logs by clicking "Set Logging Path". If you do not set a custom location, your logs will automatically be saved inside a folder titled "logs" within the Buoy folder. | You can set a custom save location for your logs by clicking "Set Logging Path". If you do not set a custom location, your logs will automatically be saved inside a folder titled "logs" within the Buoy folder. | ||
===Clear Graph=== | ==== Clear Graph ==== | ||
If you want to clear the graph and start with a fresh canvas, click "Clear Graph". | If you want to clear the graph and start with a fresh canvas, click "Clear Graph". | ||
===En/Disable Powersave=== | ==== En/Disable Powersave ==== | ||
While the graphing has been optimized over time (it should use less than 3% CPU on most modern processors), CPU load can be further reduced if running on limited hardware like a raspberry pi or with limited mobile battery. For example, an Intel i5 8350u will handle a standard "Line" graph at about 1.2-2.3% CPU. With powersave mode active, it should handle this graph at about 0.7-0.9% CPU. | While the graphing has been optimized over time (it should use less than 3% CPU on most modern processors), CPU load can be further reduced if running on limited hardware like a raspberry pi or with limited mobile battery. For example, an Intel i5 8350u will handle a standard "Line" graph at about 1.2-2.3% CPU. With powersave mode active, it should handle this graph at about 0.7-0.9% CPU. | ||
| Line 56: | Line 47: | ||
* Circle: 1.8% / 0.5% | * Circle: 1.8% / 0.5% | ||
===Max Display Seconds=== | ==== Max Display Seconds ==== | ||
You can change how many seconds of data to display, from 1 second up to a maximum of 360 seconds (6 minutes). In the box next to "Max Display Seconds" you can type how many seconds you wish to display. This works in integers only (1, 2, 3... 359, 360). Click "Apply" to apply the changes. | You can change how many seconds of data to display, from 1 second up to a maximum of 360 seconds (6 minutes). In the box next to "Max Display Seconds" you can type how many seconds you wish to display. This works in integers only (1, 2, 3... 359, 360). Click "Apply" to apply the changes. | ||
===Graph Types=== | ==== Graph Types ==== | ||
There are four different ways to display the graph: Line (default), Point, Fill, and Circle. We may add more in the future. You can view an example of how these graphs look below: | There are four different ways to display the graph: Line (default), Point, Fill, and Circle. We may add more in the future. You can view an example of how these graphs look below: | ||
| Line 74: | Line 65: | ||
===Graphing Parameters and Colors=== | ===Graphing Parameters and Colors=== | ||
While graphing, you will see the parameter listed as a button below the other buttons. Click on a button to change the color of the corresponding graphed parameter. | While graphing, you will see the parameter listed as a button below the other buttons. Click on a button to change the color of the corresponding graphed parameter. | ||
== Tune == | |||
From this tab you will control the finer points of your SSSICK through tuning. | |||
Read more on the [[SSSICK/BUOY/Tuning|Tuning page]]! | |||
You can also perform a full reset of your SSSICK by clicking "Reset". This will return it to default firmware values. Do this if you have made many changes and it just doesn't seem to be going in the right direction, or if you are experiencing any trouble. | |||
==About== | ==About== | ||
Latest revision as of 05:59, 25 September 2023

Installation
There is no system-wide installation necessary. This was developed as a portable program that can be run from anywhere (thumb-drive, hard-drive, cloud storage, etc) on Windows or Linux machines. All you need to do is extract the contents of the compressed folder to any location, then run the executable. That's it!
Usage
There are four taps on the sidebar: Setup, Graph, Tune, and About.
Setup
You will configure your connection and connect to your SSSICK from here. The list menu displays available devices and ports. Select the port at which your unit is connected, and click "connect" to connect. In Windows you should see "SSSICK" or the port and port number. In Linux you will see the corresponding raw device path (e.g. "/dev/tty9" or "dev/rfcommX" if using rfcomm to connect).
Click "disconnect" while connected in order to disconnect.
Click "refresh" to update the drop-down with currently available devices and ports. When not connected to a device, this list automatically updates every 2 seconds.
Error Codes
The SSSICK can store running error codes for any number of things, such as out of specification sensors, power supply issues, problems reading or writing from internal memory, and even self-tests to verify the true output from the SSSICK is what it should be.
If your SSSICK's LED is red (and you have not set it to red through the custom LED color section), then your SSSICK has a stored error code. Click "Read Codes" to display which codes your unit had stored. Click "Clear Codes" to clear any stored codes.
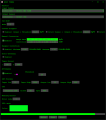
Graph

From this tab you can display, graph, and log airflow and air temperature (on HW R020 and newer) values.
Airflow Display
Airflow is displayed on both the graph and on the top-right corner of the window in large text to make for easy reading.
Start Graphing
To start showing and graphing, click "Start Graphing".
Start Logging
To log what is being graphed, click "Start Logging".
Set Logging Path
You can set a custom save location for your logs by clicking "Set Logging Path". If you do not set a custom location, your logs will automatically be saved inside a folder titled "logs" within the Buoy folder.
Clear Graph
If you want to clear the graph and start with a fresh canvas, click "Clear Graph".
En/Disable Powersave
While the graphing has been optimized over time (it should use less than 3% CPU on most modern processors), CPU load can be further reduced if running on limited hardware like a raspberry pi or with limited mobile battery. For example, an Intel i5 8350u will handle a standard "Line" graph at about 1.2-2.3% CPU. With powersave mode active, it should handle this graph at about 0.7-0.9% CPU.
For a laptop with an Intel i5 8350u, these are expected *peak* CPU loads (powersave disabled / enabled), though average CPU load is lower:
- Line: 2.1% / 1.3%
- Point: 4.2% / 1.2%
- Fill: 2.5% / 1.5%
- Circle: 1.8% / 0.5%
Max Display Seconds
You can change how many seconds of data to display, from 1 second up to a maximum of 360 seconds (6 minutes). In the box next to "Max Display Seconds" you can type how many seconds you wish to display. This works in integers only (1, 2, 3... 359, 360). Click "Apply" to apply the changes.
Graph Types
There are four different ways to display the graph: Line (default), Point, Fill, and Circle. We may add more in the future. You can view an example of how these graphs look below:
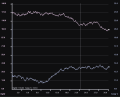
Line graph
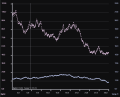
Point graph
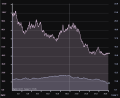
Fill graph
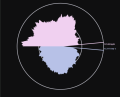
Circle graph


With the Line, Point, and Fill graphs, you can view data at a certain point by hovering over the graph at the time period you want to check. The data for that time will show in the lower-left corner of the graph.

Graphing Parameters and Colors
While graphing, you will see the parameter listed as a button below the other buttons. Click on a button to change the color of the corresponding graphed parameter.
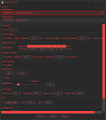
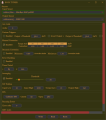
Tune
From this tab you will control the finer points of your SSSICK through tuning.
Read more on the Tuning page!
You can also perform a full reset of your SSSICK by clicking "Reset". This will return it to default firmware values. Do this if you have made many changes and it just doesn't seem to be going in the right direction, or if you are experiencing any trouble.
About
This page displays your current version of Buoy, the README.txt file contents, and a quick section describing basics of the program.
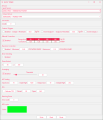
Themes
You can select from a number of different themes that change the colors and style of Buoy. You can find the theme menu on the top main menu bar.
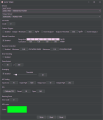
Dark
Light
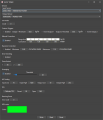
Windows Dark
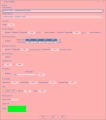
Bubblegum
Terminal
Vampire
Foliage


